
Olink Explore HT and Olink Reveal use the same technology but answer different questions. Explore HT measures more than 5,400 proteins per sample and suits discovery across the proteome; Reveal measures 1,034 assays, weighted toward inflammation and immune response and toward proteins with high detection rates in blood. Choose Explore HT when you need the widest search, including intracellular and tissue-enriched proteins, and Reveal when your question sits in immune and disease pathways. [1–4]
Both platforms, used for plasma proteomics and other sample types, use Olink’s Proximity Extension Assay (PEA) with a next-generation sequencing (NGS) readout, report results as Normalized Protein eXpression (NPX), and are for research use only. On the proteins they share, their results agree closely, with a median correlation of 0.98. [2, 4] Protavio, a certified Olink service provider, runs both Olink Explore HT and Olink Reveal analysis, with bioinformatic analysis included in every project.
How do Olink Reveal and Explore HT compare?
| Olink Explore HT | Olink Reveal | |
|---|---|---|
| Content | 5,400+ proteins, one library | 1,034 assays |
| Sample used | 2 µL (10 µL needed per sample) | 4 µL |
| Precision (median CV, intra / inter) | 10.2% / 8.8% | 7.2% / 4.2% |
| Library | Near proteome-wide, including intracellular and tissue-enriched proteins | Prioritized from UK Biobank disease-risk data; high detection rates in blood; 537 inflammation-related proteins |
| Pathway coverage (Reactome: all 2,782 / 226 immune) | 84.5% / 99% | 63.9% / 96% |
| Designed for | Proteome-wide discovery | Focused discovery on immune and disease pathways |
Sources: Olink validation data for Explore HT (2023) and Olink Reveal (2025), the two products’ white papers, and Olink’s Reveal presentation (2026). Precision figures come from each product’s own validation study, with different samples and run designs, so they are not a head-to-head comparison. [1–4, 11]
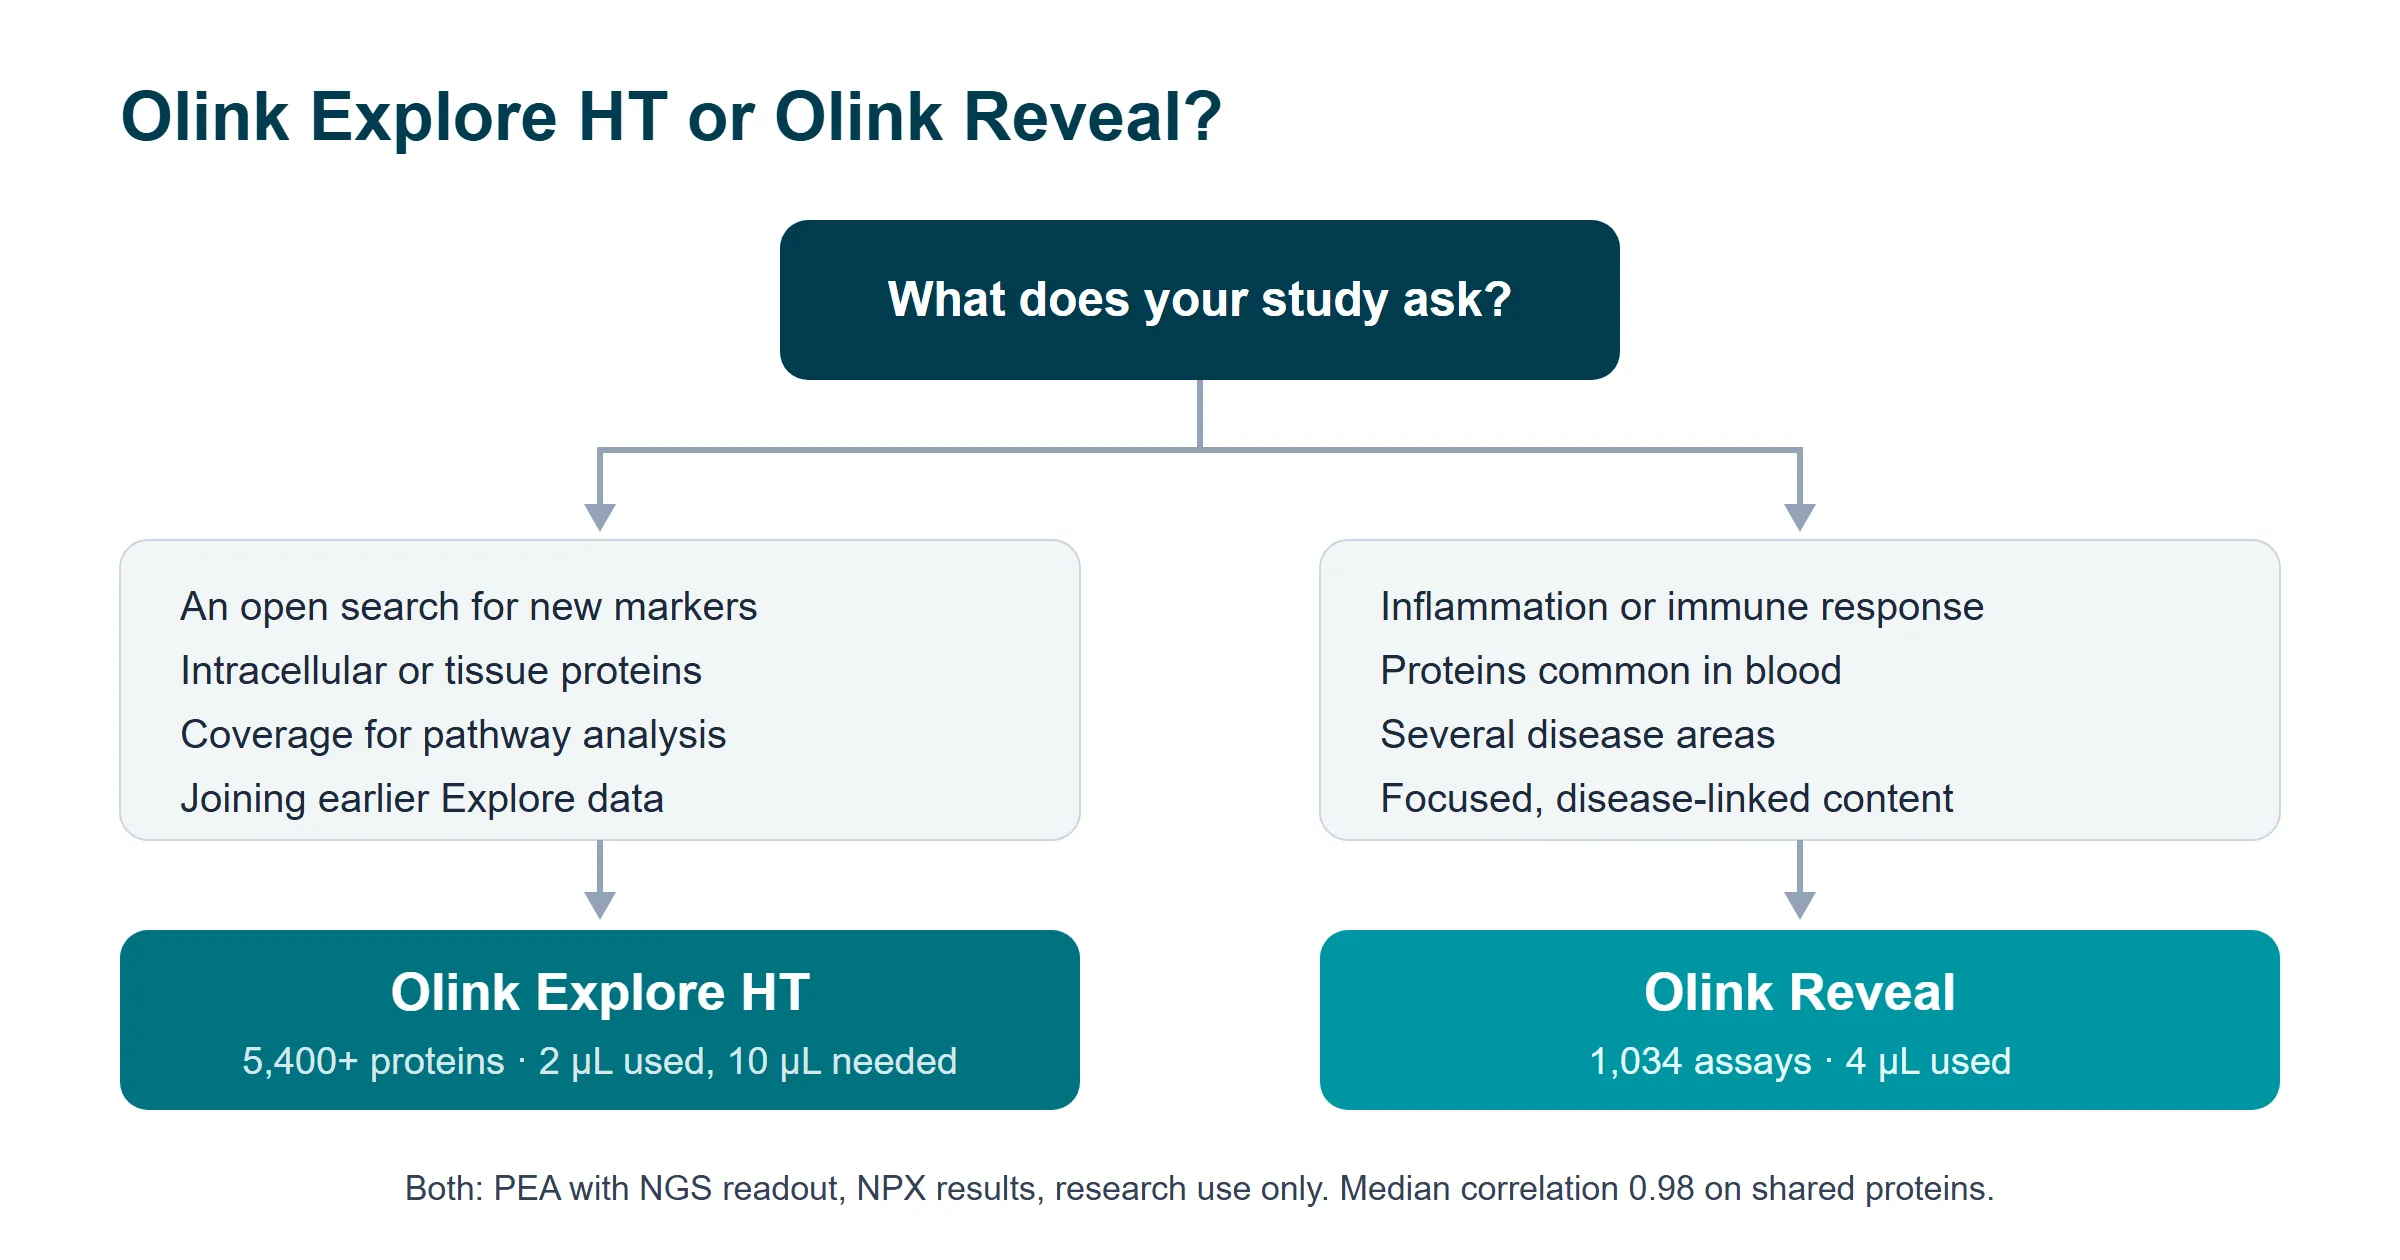
When to choose Olink Explore HT
- Your question needs the widest search. With more than 5,400 proteins, Explore HT includes many intracellular and tissue-enriched proteins that appear in blood with tissue damage or disease. [3]
- You don’t yet know which pathways are involved. A wider library raises the chance that the proteins that matter are measured at all.
- The results will feed pathway analysis, where coverage of the proteome matters. [11]
- You are continuing earlier Olink Explore work. Data from Olink Explore 3072 can be joined with Explore HT data through bridging samples run on both. [3]
Expect fewer proteins to be detected in healthy samples than the library size suggests: many of its intracellular and tissue-specific proteins are absent from healthy blood and enter circulation with cell death or tissue damage, so detection depends on the cohort and the sample type. In one study of EDTA plasma from 100 people sampled at four ages, 3,509 of 5,416 proteins passed the detectability criteria. [3, 10]
When to choose Olink Reveal
- Your question is about inflammation or immune response. Reveal includes 537 inflammation-related proteins, and its library maps to 96% of Reactome’s immune response pathways. [4]
- Your study spans several disease areas. In UK Biobank data, at least one Reveal protein is linked to 96.1% of the diseases with a significant protein association. [4]
- You want proteins that are commonly detected in blood. Reveal’s proteins have high detection rates in plasma and serum, with 86% average detectability in Olink’s data. [4, 9]
Questions to ask before you decide
- What comparison will the study test? A question about a specific biological process often fits Reveal; an open search for new markers fits Explore HT.
- How much sample do you have? Explore HT uses 2 µL per sample and needs 10 µL per sample; Reveal uses 4 µL. [1, 2]
- Will you combine the data with earlier Olink studies? Bridging is planned before samples are run, not after. [3]
- How will you confirm the findings? Either platform produces candidates; plan an independent cohort or a second method from the start. [5]
How published studies used each platform
- Explore HT, longitudinal design: a study of carriers of ALS-linked gene variants, patients with ALS and controls measured 516 serial plasma samples from 137 people; a 19-protein panel predicted which carriers would develop ALS (cross-validated AUC 0.80–0.89). [6]
- Explore HT, discovery and replication: a study of ovarian tumors used two cohorts of 171 and 233 women and found an eight-protein panel that separated benign from malignant tumors in the replication cohort (AUC 0.96). [7]
- Reveal, case-control with patient subgroups: a study of 248 patients with bipolar disorder and 76 controls found broad protein differences and two patient subgroups that the pooled comparison did not show. [8]
Frequently asked questions
What is the difference between Olink Reveal and Olink Explore HT?
Both use Olink’s Proximity Extension Assay with an NGS readout and report results as NPX. Olink Explore HT measures more than 5,400 proteins, including many intracellular and tissue-enriched proteins, for proteome-wide discovery. Olink Reveal measures 1,034 assays, with 537 inflammation-related proteins, for focused discovery on immune and disease pathways. On shared proteins their results agree closely, with a median correlation of 0.98. [1–4]
How many proteins does Olink Reveal measure?
Olink Reveal measures 1,034 assays: 1,028 single proteins plus 6 assays that target a protein pair or complex. 537 of the proteins relate to inflammation or immune response; the rest cover metabolism, signaling, development and other pathways. Reveal uses 4 µL of plasma or serum per sample and reports results as NPX, Olink’s relative unit on a log2 scale. [2, 4]
How many proteins does Olink Explore HT measure?
Olink Explore HT measures more than 5,400 proteins. Olink’s current assay list (2026-06-24) holds 5,416 assays in a single library, run in eight blocks by protein abundance. Because the library includes many intracellular and tissue-enriched proteins, the number detected depends on the samples and the cohort. [1, 3]
Can Explore HT and Reveal results be compared?
Yes, on the proteins both platforms measure. In Olink’s validation, Reveal and Explore HT results on shared proteins had a median correlation of 0.98. NPX is a relative unit, so data from the two platforms, or from separate runs, are combined through normalization, for example with bridging samples run on both. Plan this before the samples are analyzed. [2, 3]
Which platform needs less sample?
Explore HT uses less sample in the assay itself: 2 µL per sample against 4 µL for Reveal, although Explore HT needs 10 µL per sample to set up the run. The difference rarely decides the choice. For a study with Protavio, send at least 50 µL per sample for either platform. [1, 2]
Plan your study with Protavio
Protavio runs both platforms as a certified Olink service provider, for Explore HT since 2024 and for Reveal since 2025, with bioinformatic analysis included in every project. Protavio’s team brings many years of multiplex proteomics across sample types and technologies (Olink and Luminex), and the analysis service runs under an ISO 9001 quality system. Read about Olink Explore HT analysis and Olink Reveal analysis, or book a call below to talk through your study design. For more on planning, see experimental design for proteomic analysis.
References
[1] Olink Proteomics. Olink Explore HT validation data (1345, v1.1, 2023), and Olink Explore HT assay list (1562, 2026-06-24).
[2] Olink Proteomics. Olink Reveal validation data (1588, v1.0, 2025), and Olink Reveal assay list (2025).
[3] Olink Proteomics. Discover more biology with confidence: Olink Explore HT white paper (1592, v1.1, 2025).
[4] Olink Proteomics. Proteomic exploration of immune and disease pathways with Olink Reveal, white paper (1662, v1.0, 2025).
[5] Protavio. Experimental design for proteomic analysis.
[6] Ran X, Wuu J, Qin ZS, et al. Longitudinal plasma proteomics predict phenoconversion to clinically manifest ALS. Nat Med. 2026;32(9):3417-3429. doi:10.1038/s41591-026-04528-x
[7] Moskov M, Hedlund Lindberg J, Lycke M, et al. Deep plasma proteomics identifies and validates an eight-protein biomarker panel that separate benign from malignant tumors in ovarian cancer. Commun Med. 2025;5:230. doi:10.1038/s43856-025-00945-0
[8] Pedraz-Petrozzi B, Boukouaci W, Godin O, et al. Plasma proteomic signatures in bipolar disorder and their implications for data-driven patient stratification. Brain Behav Immun. 2026;139:107071. doi:10.1016/j.bbi.2026.107071
[9] Olink Proteomics. Olink Reveal chronic lymphocytic leukemia case study (1598, v1.0, 2025).
[10] Bergström S, Björkander S, Bueno Álvez M, et al. Longitudinal protein profiling of blood during childhood into early adulthood. Nat Commun. 2026;17(1):3700. doi:10.1038/s41467-026-72095-3
[11] Olink Proteomics. Olink Reveal external presentation (2026-04), pathway coverage slides 13-14.